Using the HTTP API Explorer
Overview
The HTTP API Explorer lets you define, invoke, and inspect plain HTTP endpoints alongside your MCP servers. It is split across two areas in the sidebar:
- Infrastructure → HTTP API Connections — manage the connection definitions (base URL, auth, headers).
- HTTP API Explorer — browse saved APIs, invoke them, and inspect their history.
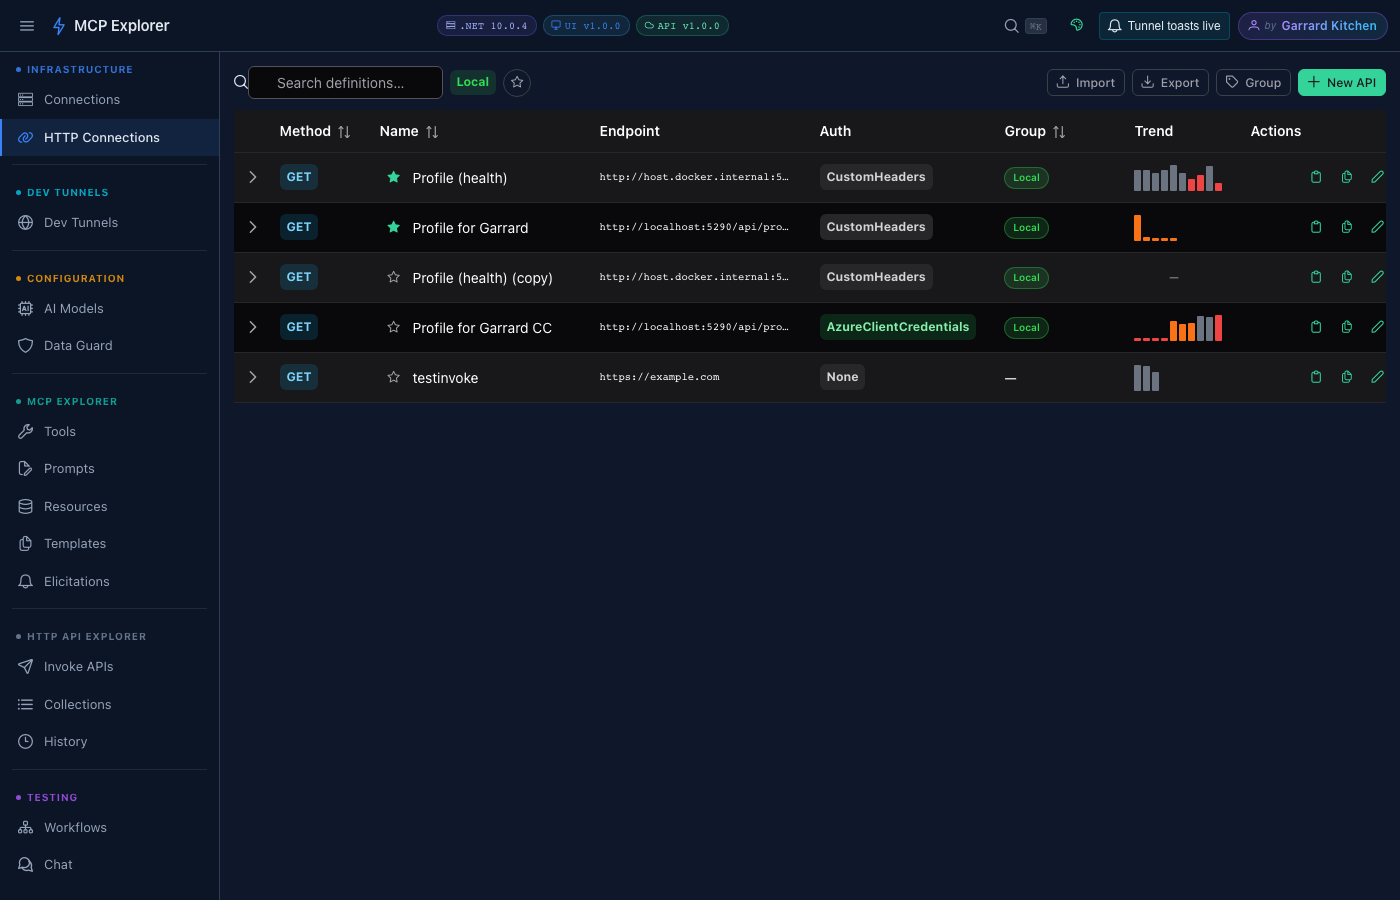
HTTP API connections live under Infrastructure in the sidebar, alongside MCP connections.
Managing HTTP API Connections
Adding a Connection
- Navigate to Infrastructure → HTTP API Connections.
- Click New API in the toolbar.
- Fill in the connection form:
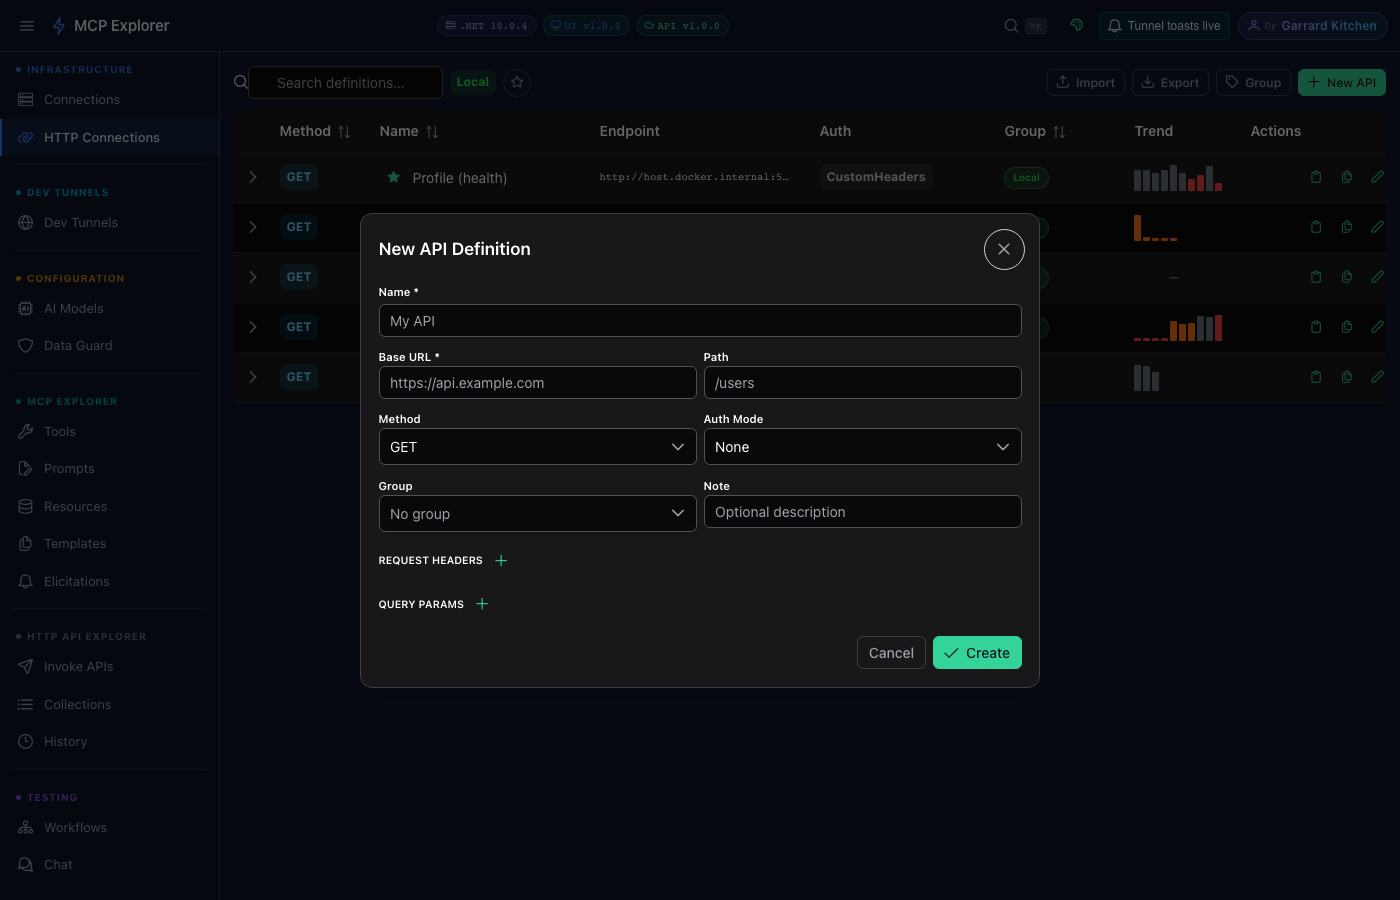
| Field | Required | Description |
|---|---|---|
| Name | ✅ | A friendly display name used in the CLI and history |
| Base URL | ✅ | The root URL — e.g. https://api.example.com |
| Method | ✅ | HTTP verb: GET, POST, PUT, PATCH, DELETE |
| Path | ❌ | Path appended to the base URL — e.g. /v1/users |
| Description | ❌ | Free-text notes |
| Headers | ❌ | Custom HTTP headers (e.g. Authorization: Bearer ...) |
Authorization Header Modes
When adding an Authorization header the form offers three modes:
| Mode | Behaviour |
|---|---|
| Raw | Value stored and sent exactly as typed — use for custom schemes |
| Bearer | Automatically prefixes Bearer if not already present |
| Basic | Automatically prefixes Basic if not already present |
Duplicating a Connection
Click the Copy icon on any row to open the New Connection dialog pre-populated with all fields from the selected connection and a unique Copy of … name. Useful for creating variants of an existing endpoint.
Editing and Deleting
Use the pencil and trash icons on any row to edit or delete a definition.
Browsing and Invoking APIs
Navigate to HTTP API Explorer in the sidebar to see the invoke list.
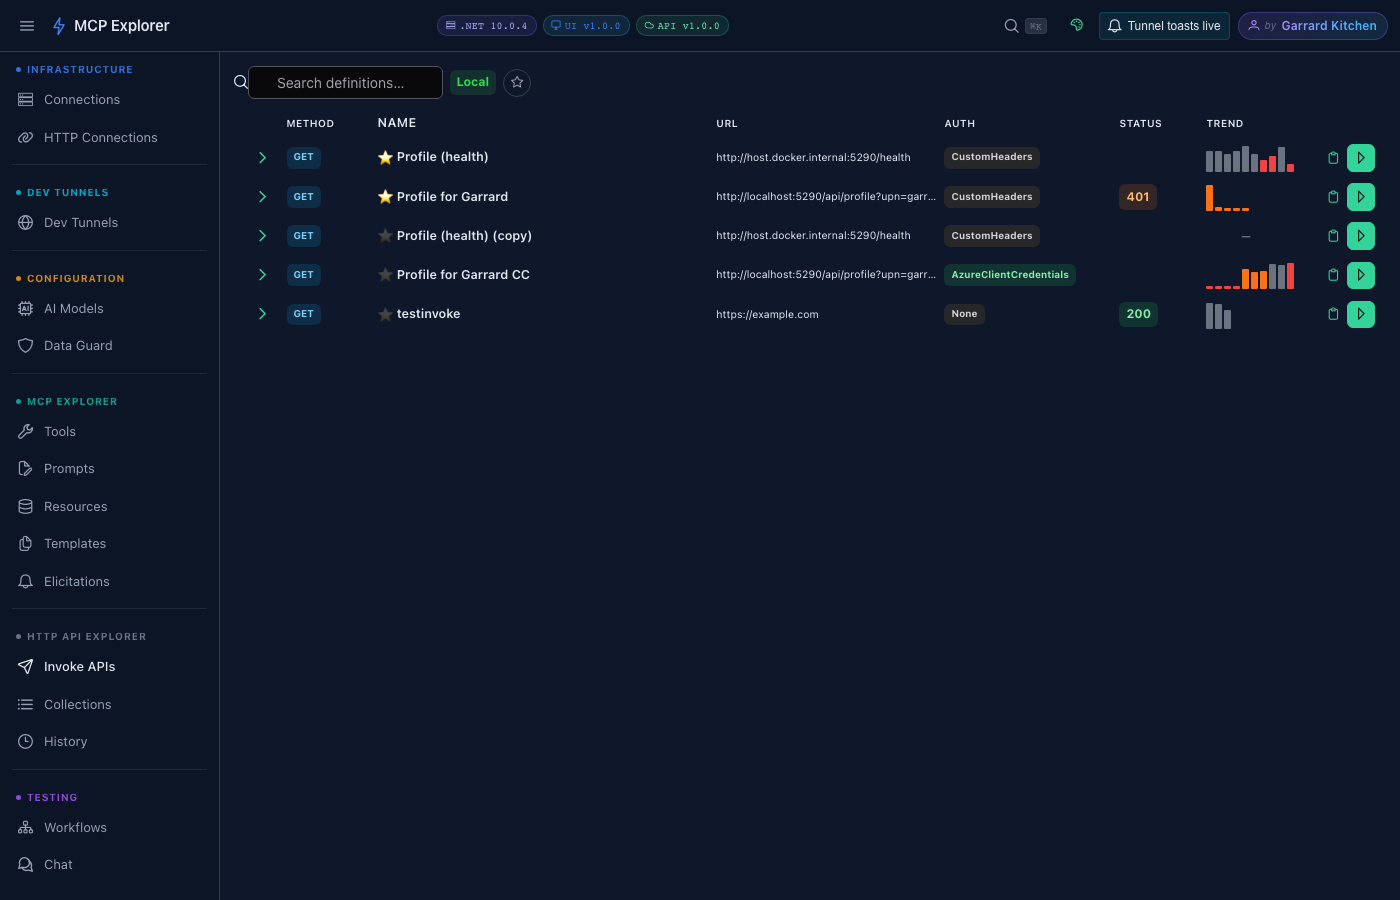
Each row shows the API name, URL, last status code, last invoked time, and a mini sparkline of the last 10 run durations and health.
The Trend Column (Sparkline)
Every API row includes a Trend sparkline — a mini bar chart of the last 10 invocations:
| Bar colour | Meaning |
|---|---|
| 🟢 Green | 2xx response, schema matches baseline |
| 🟠 Orange | HTTP error or schema drift detected |
| 🔴 Red | Request failure or timeout |
| ⚪ Grey | No baseline comparison available |
Bar height represents response duration. Hover any bar to see the exact value.
Invoking an Endpoint
Click the ▶ Invoke icon on any row (or inside the expanded panel) to call the endpoint immediately. The row updates with the latest status code, latency, and sparkline bar.
Runtime Template Placeholders
Endpoints can contain {name} or {name:default} placeholders in the URL path, query parameters, or request body. When you invoke an endpoint that has placeholders, a dialog prompts for values before sending the request.
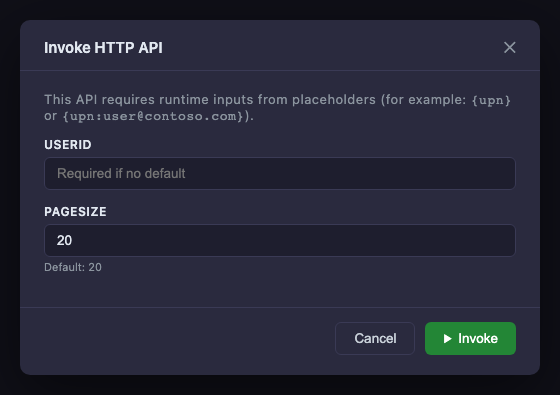
Placeholder prompt dialog. Fields with a default ({pageSize:20}) are pre-filled; required fields ({userId}) are left blank.
Syntax examples:
  /users/{userId}                       # required — prompts for userId
/items?page={page:1}&size={size:20}   # optional with defaults
Defaults are applied automatically when the field is left blank. The CLI copy button generates a command using the saved definition — templates are resolved at call time.
Invocation History
Expand any API row and click the History tab to inspect past invocations.
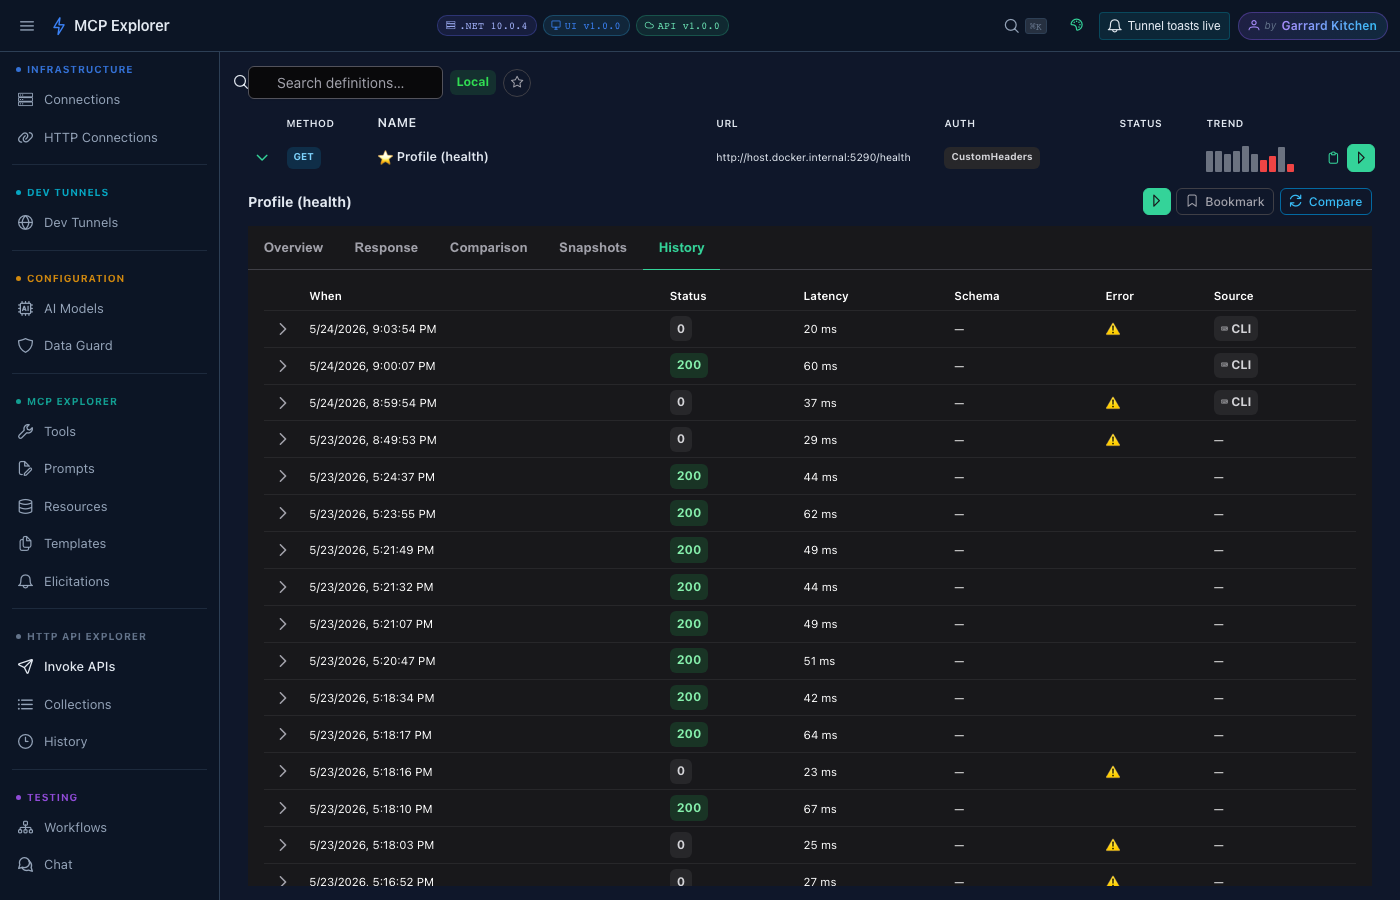
Each history entry shows the timestamp, status code, latency, and invocation source. Expand a row to reveal three tabs:
| Tab | Contents |
|---|---|
| Request | Method, URL, request headers, and request body |
| Response Headers | All response headers from the server |
| Response Body | Full response body (up to 1 MB — no truncation) |
A Source badge on each row shows whether the invocation was triggered from the App (🖥) or the CLI (⌨).
Note: Sensitive values (auth headers, credentials, high-entropy path segments) are automatically redacted before being written to history. The redacted form is shown both in the UI and in any exported data.
CLI Copy Button
Both the Infrastructure connections view and the HTTP API Explorer invoke view include a 🖥 Copy CLI command button on each row. Clicking it copies a ready-to-run mcp-http command to your clipboard, including the correct --data-path and --use-localhost flags for your environment.
See the CLI — API & Collection Commands page for full CLI reference.