Using Dev Tunnels
Overview
The Dev Tunnels page — labelled Signal Deck in the UI — is MCP Explorer’s built-in webhook ingress control room. It wraps Microsoft’s devtunnel CLI to create a stable public HTTPS callback URL, captures every HTTP request that arrives at that URL in real time via SSE, and lets you inspect or replay those requests without leaving the app.
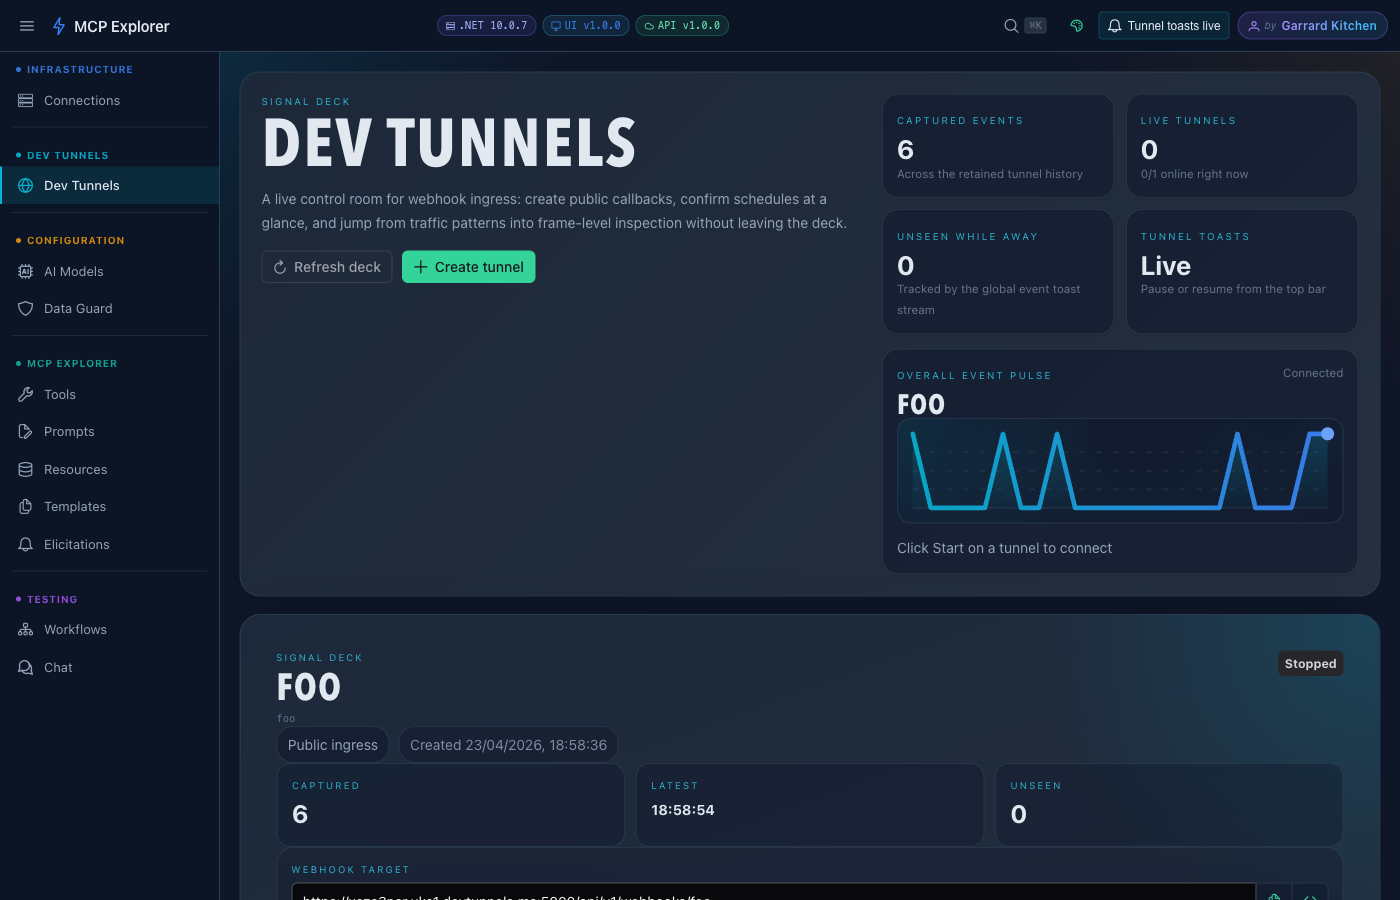
The Signal Deck dashboard: summary statistics (captured events, live tunnels, unseen events, notification mode), an overall event pulse sparkline, and a card for each configured tunnel.
Prerequisites: The
devtunnelCLI must be installed inside the container (or on the host when running without Docker). If it is missing or misconfigured, Dev Tunnels shows a CLI unavailable banner instead of failing silently.
Typical Workflow
- Create a tunnel with a name and access mode.
- Start the tunnel — MCP Explorer launches
devtunnel hostand surfaces the public webhook URL. - Register the webhook URL with any external service (Stripe, GitHub, your MCP tool, a scheduler, etc.).
- Inspect incoming requests in real time on the inspector page.
- Replay any stored request to a target endpoint for debugging.
Creating a Tunnel
- Navigate to Dev Tunnels in the sidebar.
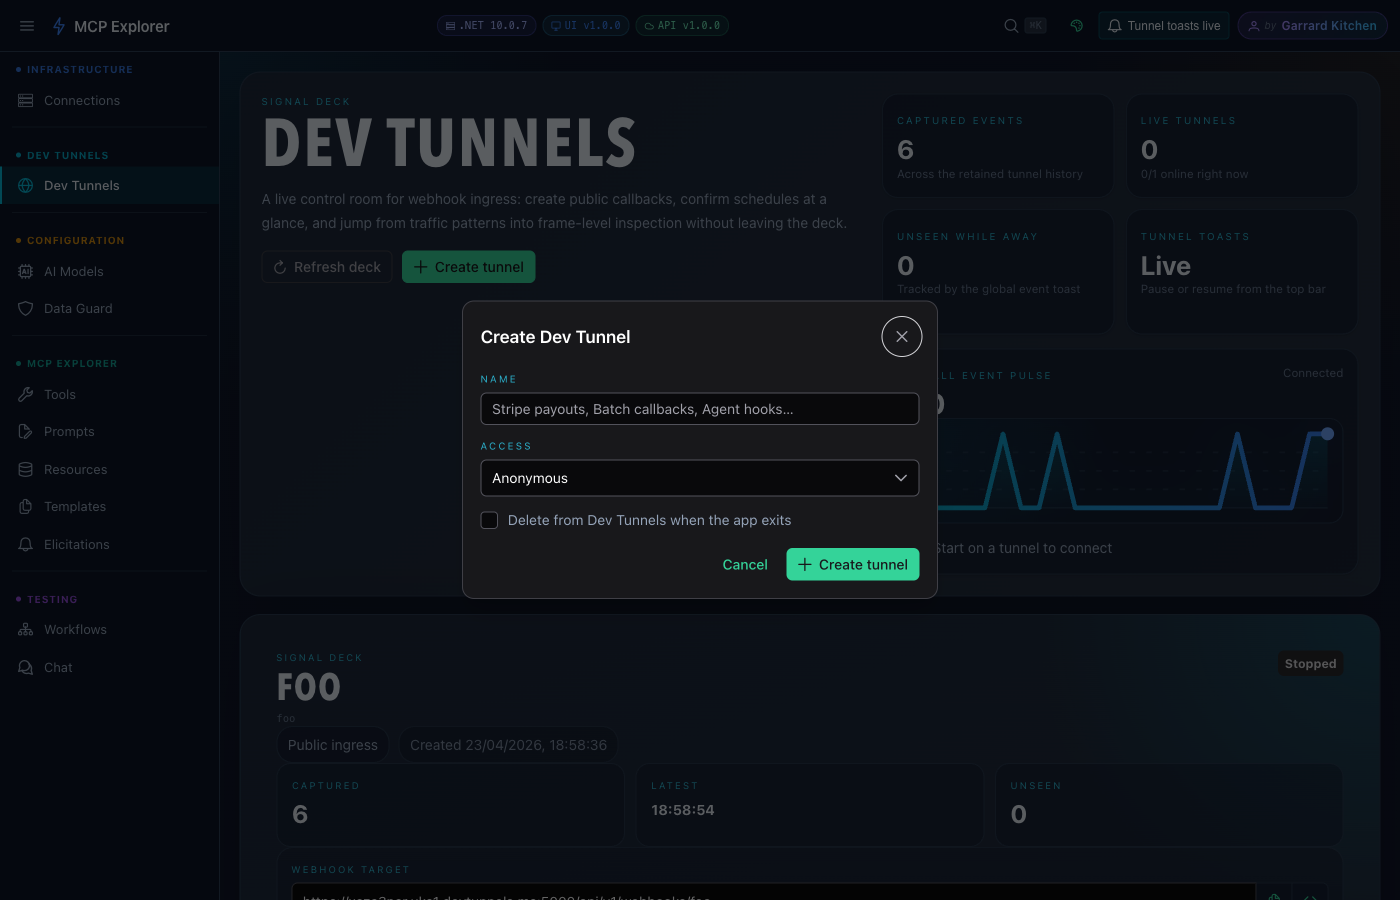
- Click Create tunnel in the top-right toolbar.
- Fill in the Create Dev Tunnel dialog:
| Field | Required | Description |
|---|---|---|
| Name | ✅ | A memorable label — e.g. Stripe payouts, Agent hooks, Batch callbacks |
| Access | — | Anonymous (no token required for callers) or Authenticated (callers must present a token) |
| Delete on exit | ❌ | When checked, the tunnel is removed from the devtunnel service when MCP Explorer stops |
- Click Create tunnel. MCP Explorer registers the tunnel definition and navigates to its inspector page.
Tip: Use Anonymous access when you need an external service (Stripe, GitHub Webhooks, etc.) to POST without any credentials. The
devtunnelCLI host still requires a one-time sign-in.
Starting a Tunnel
Click Start on any tunnel card on the Signal Deck, or click Start tunnel in the inspector header.
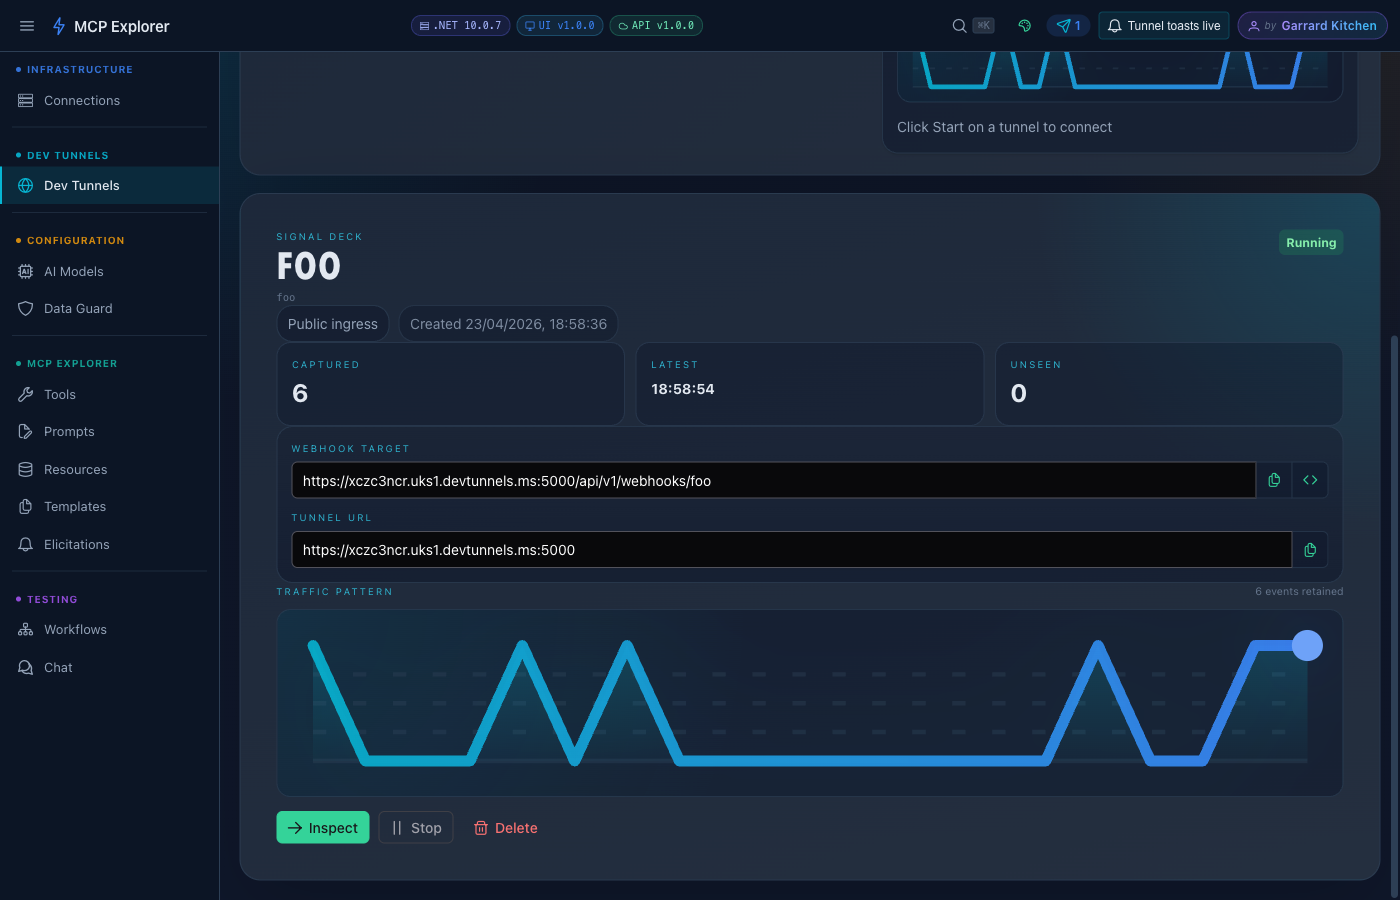
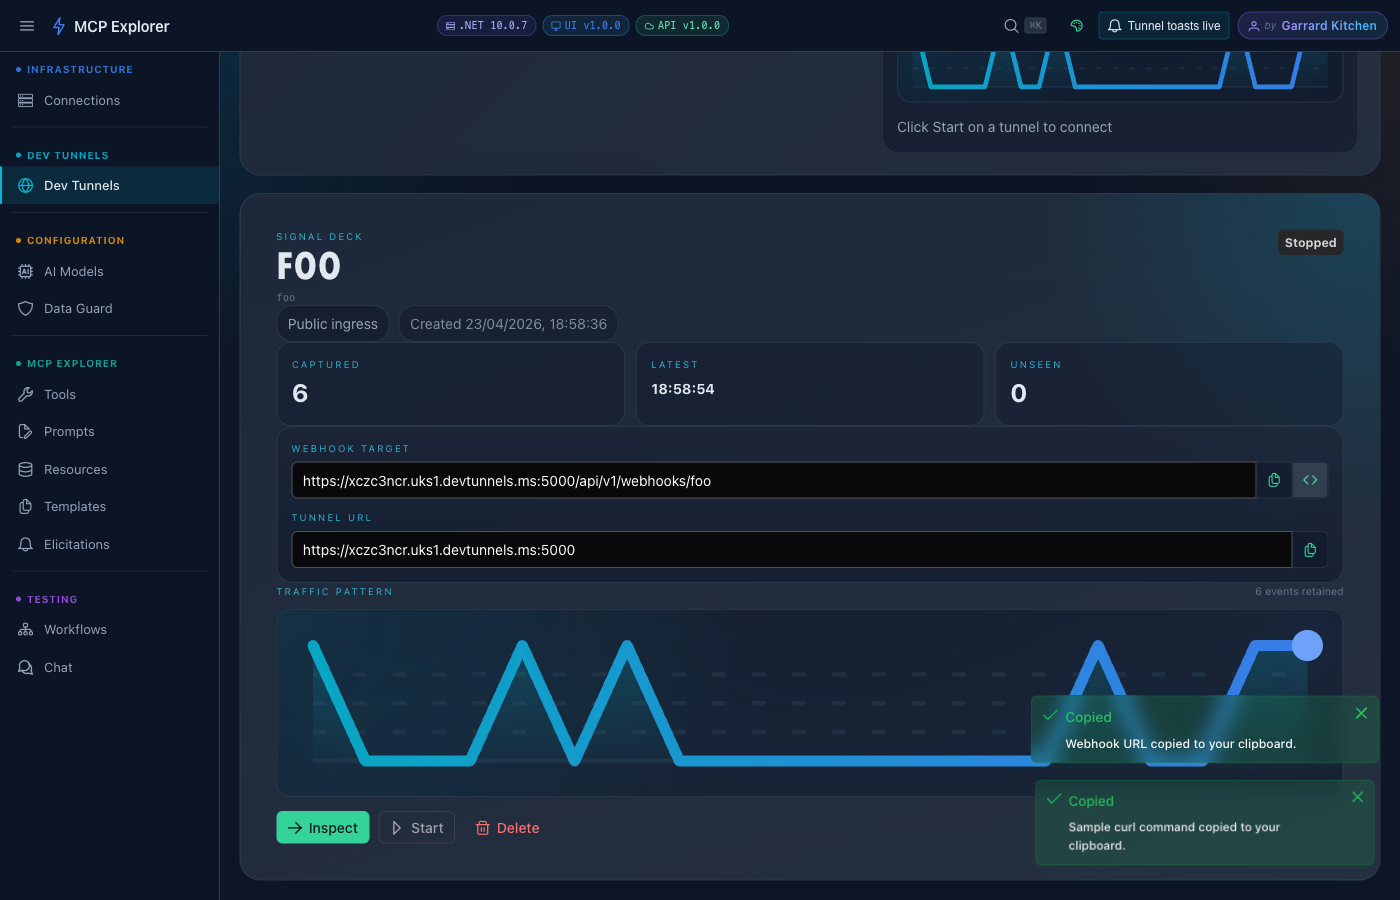
A running tunnel card shows the Running status badge, a live event count, a mini traffic sparkline, and quick-action buttons (Inspect, Copy webhook URL, Copy curl, Stop, Delete).
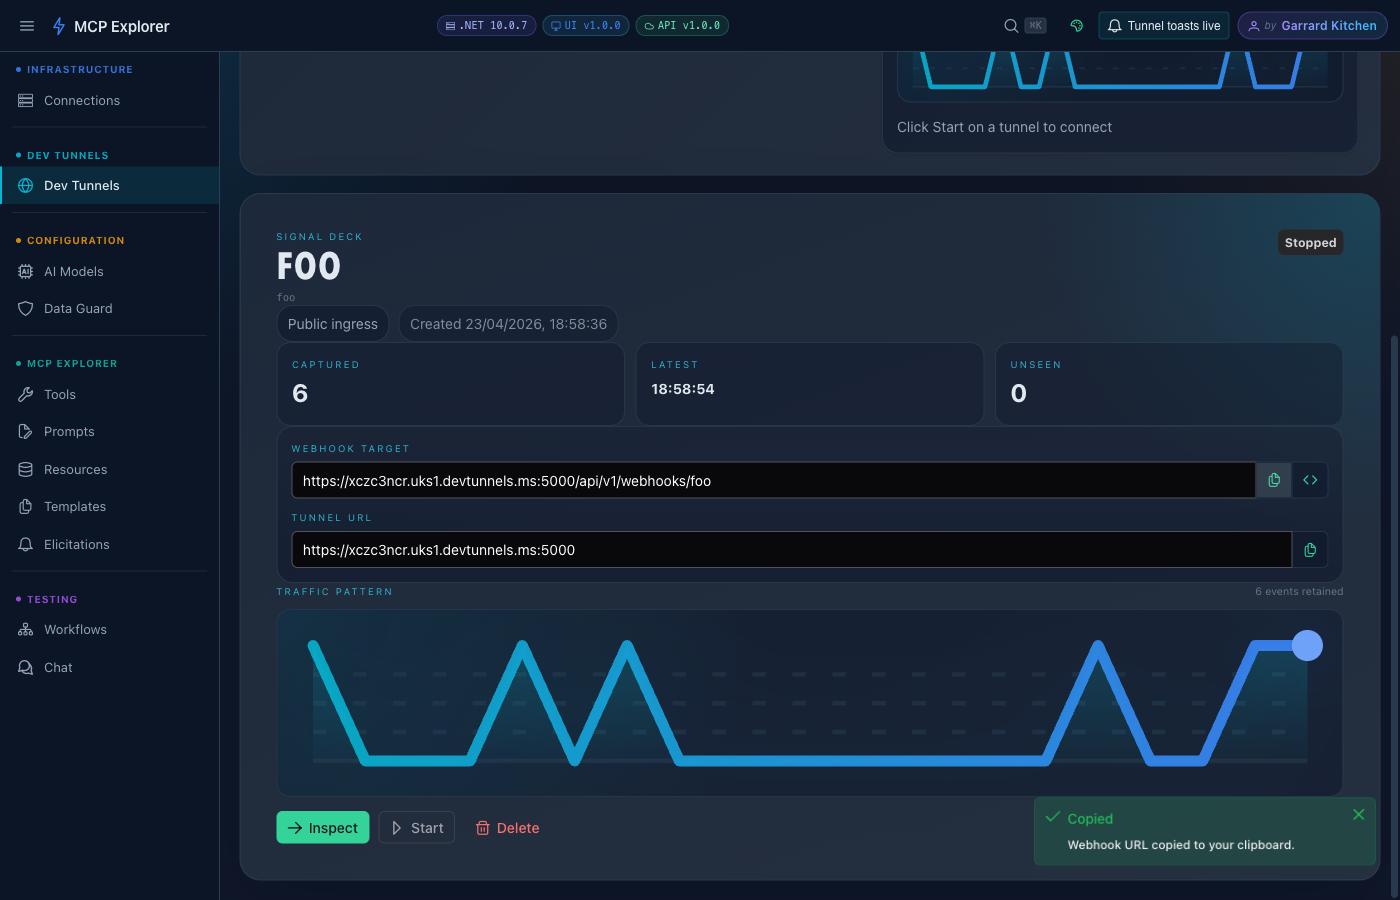
Clicking Copy webhook URL or the </> (Copy curl) icon copies the value to your clipboard and confirms with a brief toast:
Login Required
If the devtunnel CLI has not been authenticated yet, starting a tunnel opens the Device Code Login dialog:
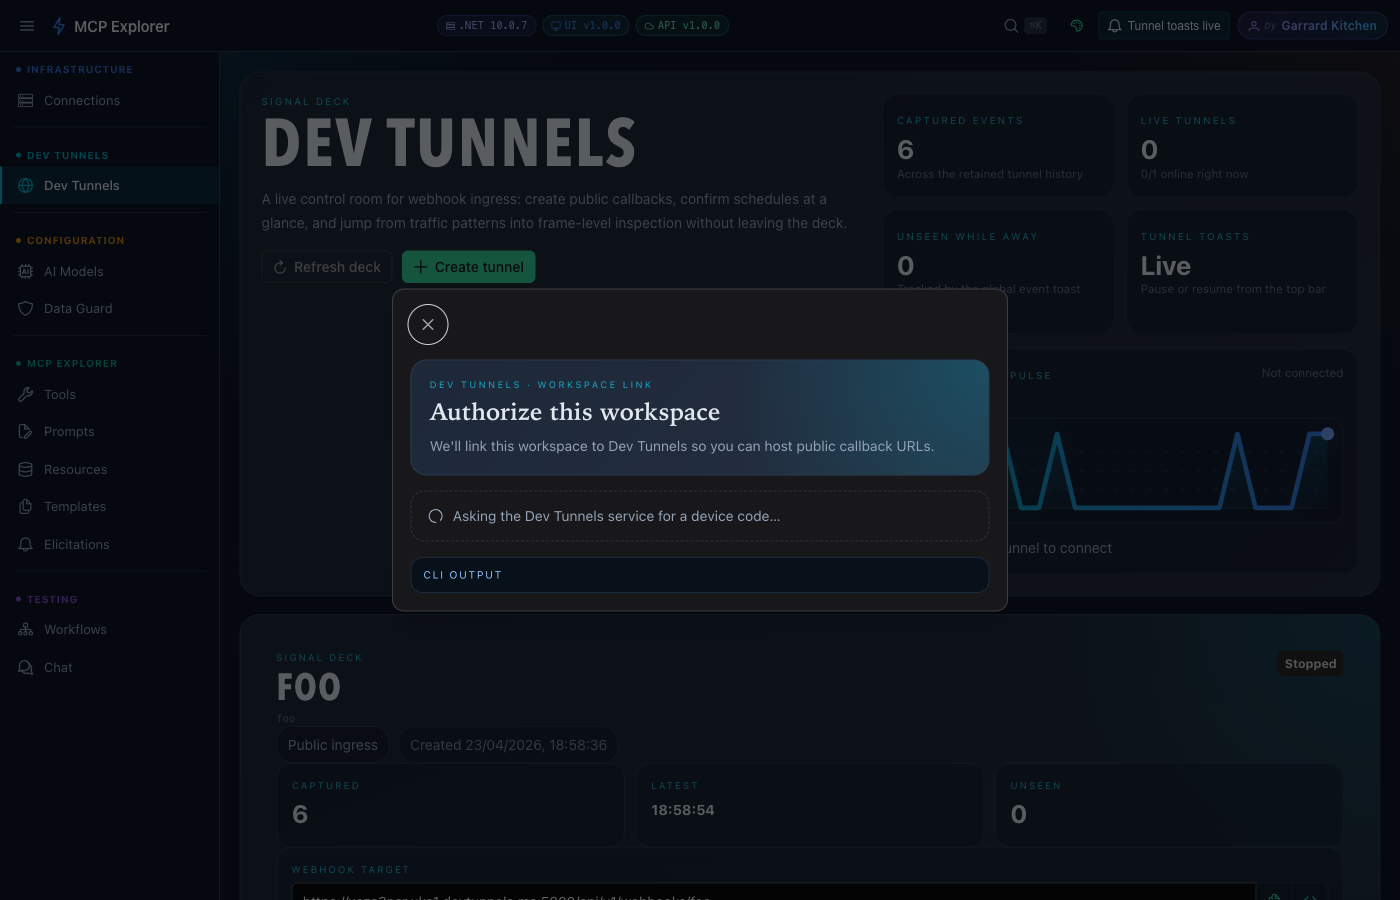
The dialog opens and immediately begins streaming devtunnel login output. Once the verification URL and device code appear, open the URL in your browser, enter the code, and sign in with your Microsoft account. The dialog closes automatically once authentication succeeds and resumes the pending start operation.
Tip — skip login entirely with Docker Compose: Set
HOST_DEVTUNNELS_DIRin your.envfile to your host machine’s DevTunnels credentials directory and the container will inherit your existingdevtunnel user loginsession. See the Environment Variables reference for per-OS paths.
Tunnel Statuses
| Status | Meaning |
|---|---|
Stopped | Tunnel is defined but not running |
Starting | CLI is being launched |
Running | Public URL is live and accepting traffic |
LoginRequired | CLI needs authentication before it can start |
Error | Start failed — hover the card for the error message |
The Signal Deck Dashboard
The main Dev Tunnels page is a live control room for all your tunnels.
Summary Statistics
| Metric | Description |
|---|---|
| Captured events | Total webhook requests stored across all tunnels |
| Live tunnels | Number of tunnels currently in Running state |
| Unseen while away | Events that arrived while you were on another page |
| Tunnel toasts | Whether the global event notification stream is Live or Paused |
Overall Event Pulse
A histogram sparkline aggregating traffic across all tunnels. The busiest tunnel’s name is displayed alongside the chart.
Inspecting Events
Click Inspect on any tunnel card (or click the tunnel’s name) to open the Tunnel Inspector.
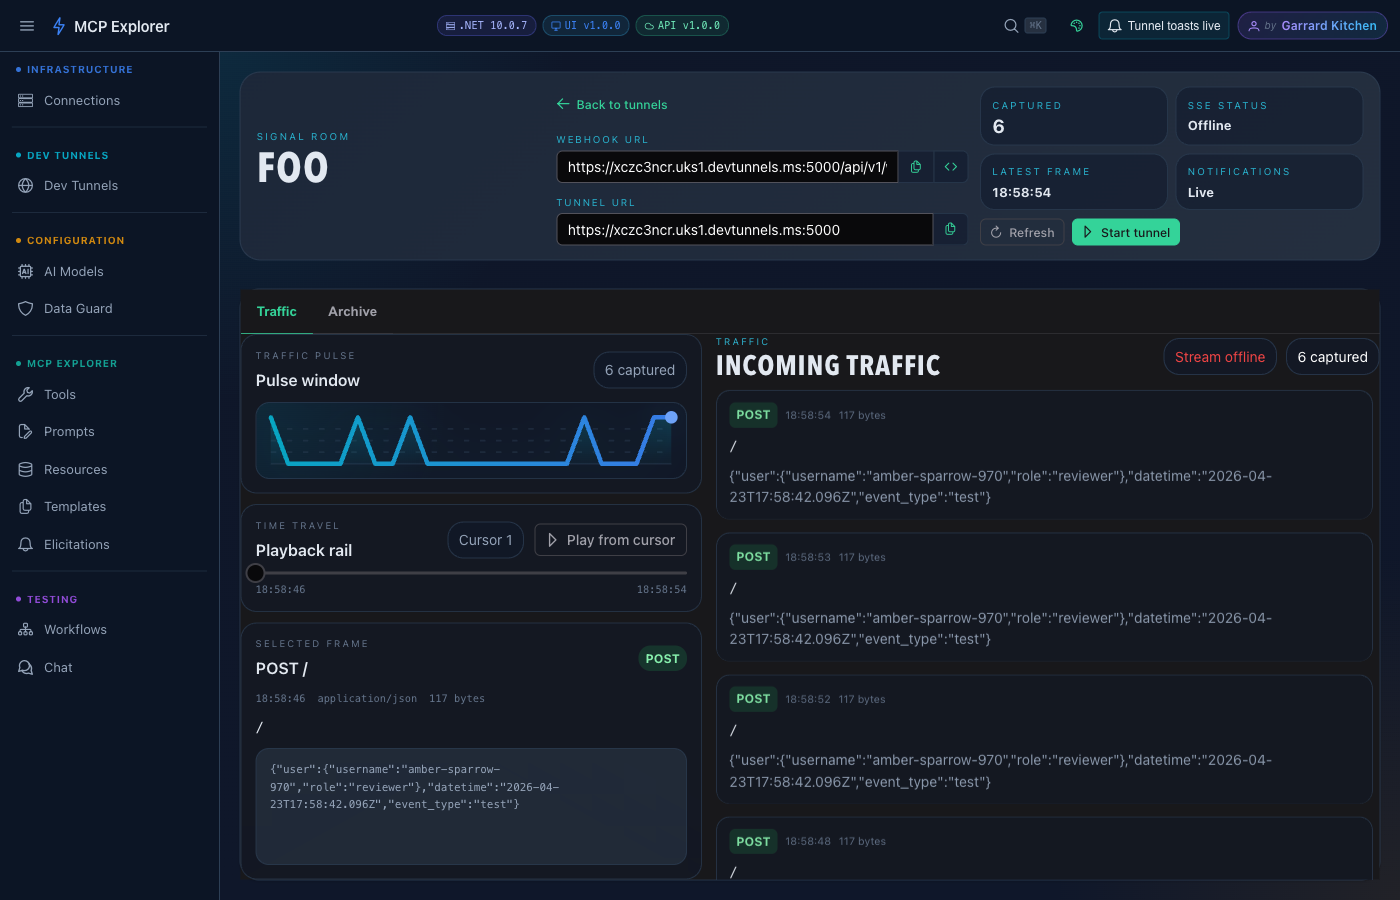
The Traffic tab: a histogram scrubber (left) for timeline navigation with play/pause, and an event tape (right) showing each captured request animating in real time.
Inspector Header
The inspector header shows the Webhook URL and Tunnel URL as read-only fields — click the copy icon to put either on the clipboard, or click the </> icon to copy a ready-to-paste curl command.
Four metric cards show:
- Captured — total events stored for this tunnel
- SSE status —
Online/Syncing/Offline - Latest frame — timestamp of the most recent event
- Notifications — Live or Paused
Traffic Tab
The Traffic tab is split into two panels:
| Panel | Description |
|---|---|
| EventTimeline | Histogram of events over time. Click any bar to jump to that window. Use ▶/⏸ to play back events automatically. |
| EventTape | Live animated feed of incoming requests. Click any row to select it for detail inspection. |
Archive Tab
The Archive tab provides full per-event detail.
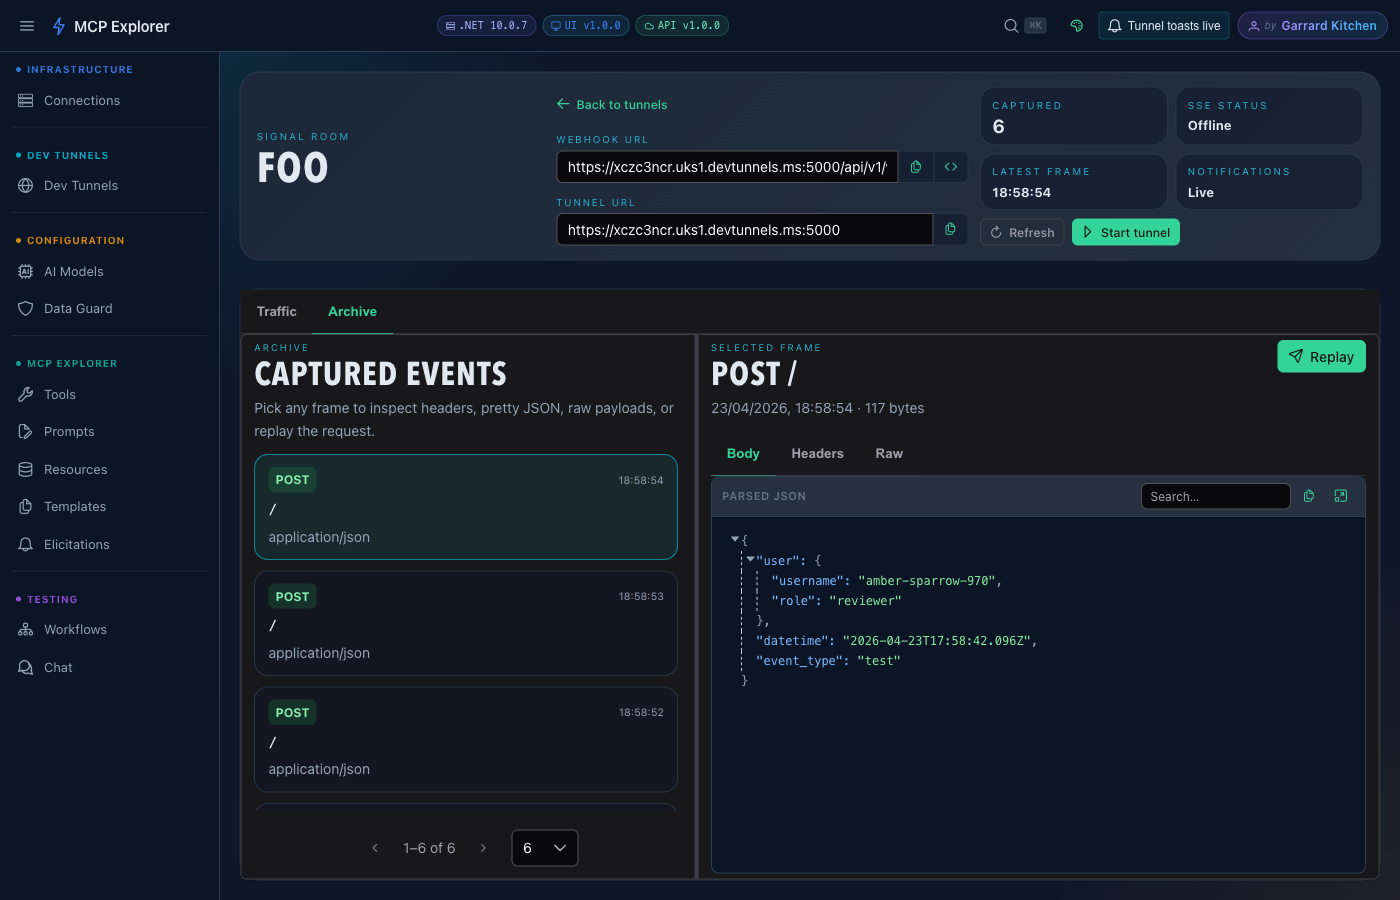
The Archive tab: method, path, query string, headers (with sensitive values masked), content type, body size, and the full request body rendered in the JSON viewer. Sensitive headers (Authorization, cookies, API-key-style values) are automatically redacted.
Each event shows:
- HTTP method and path
- Query string parameters
- Request headers (sensitive headers automatically masked)
- Content type and body size
- Full request body — rendered as pretty-printed JSON when the content type is
application/json, otherwise as plain text
Note: Very large request bodies are stored in truncated form. When a body has been truncated the event is flagged — you will see the actual body size alongside an indicator that the displayed content is partial.
Replaying a Webhook
Any captured event can be replayed to any HTTP/HTTPS target URL for downstream testing.
- Select an event in the Archive tab.
- Click Replay.
- Fill in the Replay dialog:
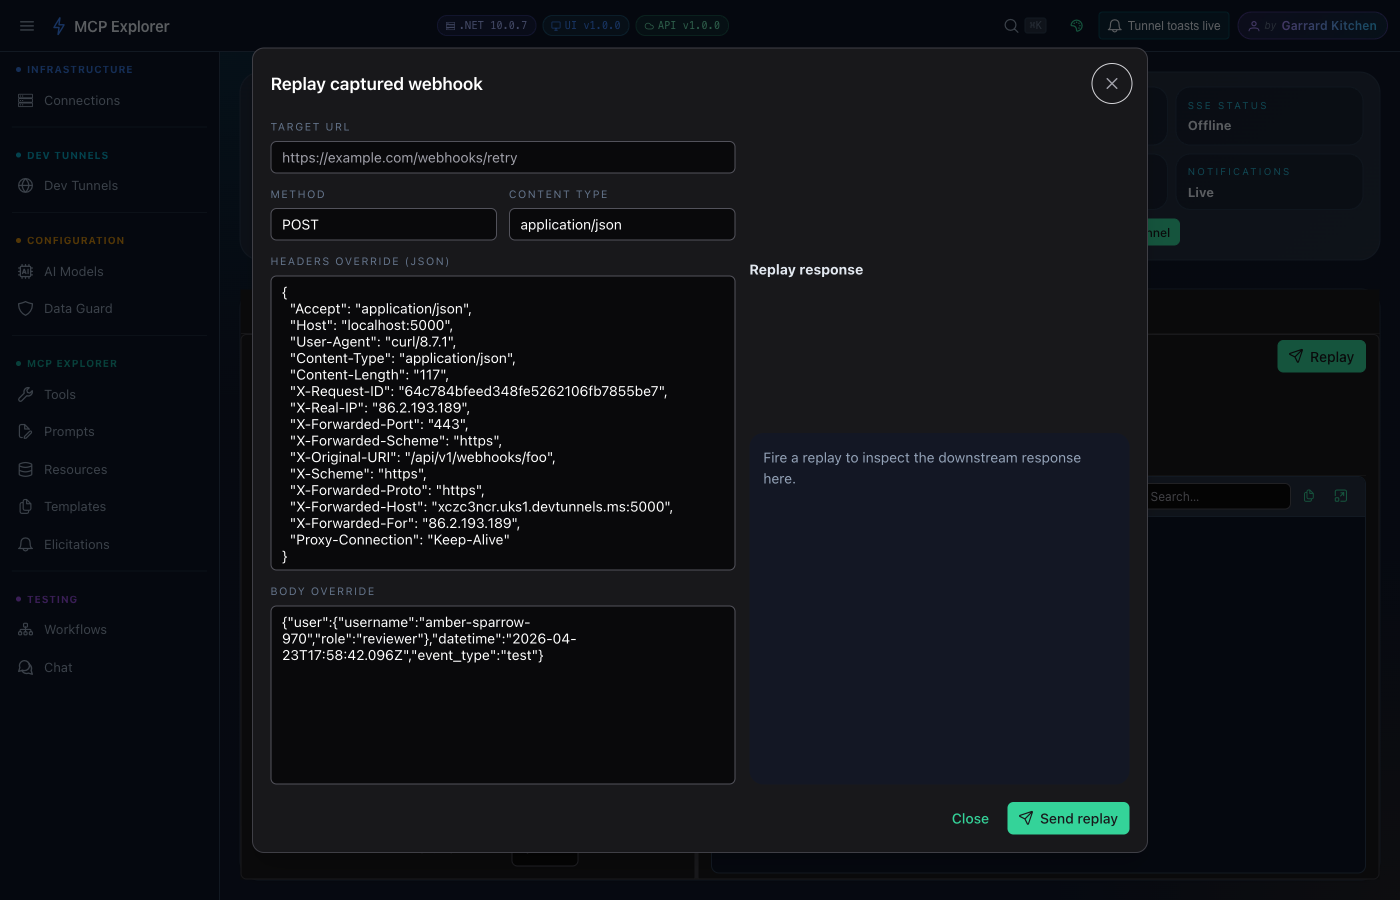
| Field | Description |
|---|---|
| Target URL | Where to send the replayed request. Must be a public HTTP/HTTPS address — loopback and private IP ranges are blocked. |
| Method override | Override the original HTTP method (optional) |
| Headers override | Replace or add specific headers (optional) |
| Body override | Replace the body content (optional) |
- Click Replay. The dialog shows the downstream response status code, headers, body, and round-trip duration inline.
Security: Replay requests are blocked to loopback addresses (
localhost,127.x.x.x), unspecified addresses (0.x.x.x), link-local ranges (169.254.x.x), private IP ranges (10.x, 172.16–31.x, 192.168.x), IPv6 link-local (fe80::/10), and IPv6 ULA (fc00::/7) to prevent SSRF.
CLI Unavailable State
If the devtunnel CLI is not found or is misconfigured, the Signal Deck shows a warning banner instead of failing with a generic error:
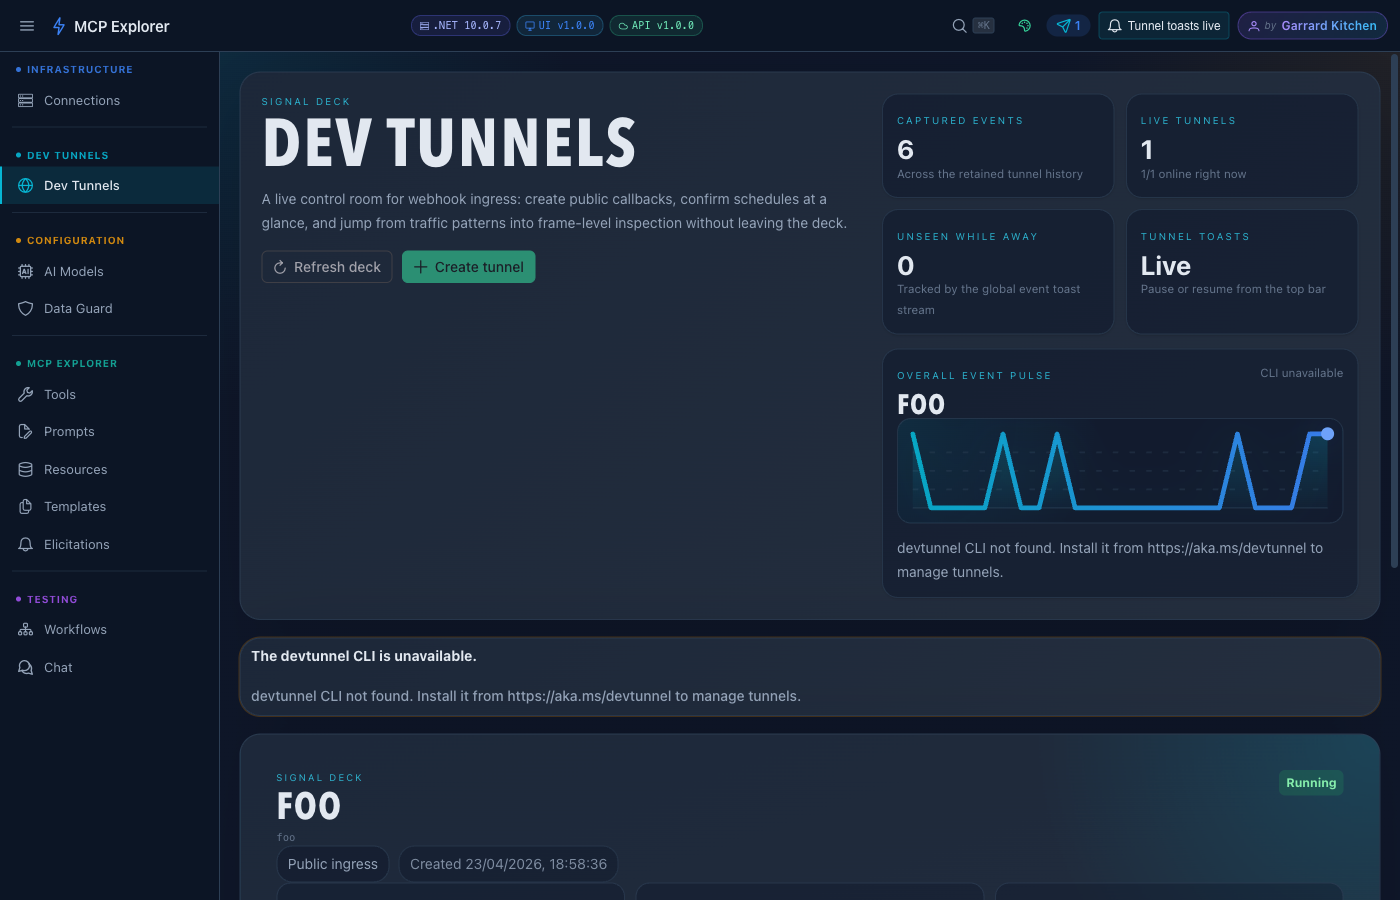
The banner shows the specific problem (e.g. CLI not found, not authenticated). Install the devtunnel CLI and restart the container to resolve it.
Installing the devtunnel CLI
Follow the official install guide. On a first run the CLI requires a one-time sign-in; MCP Explorer’s Device Code Login dialog handles this for you.
Webhook URL Smart-fill (Tool Integration)
When a tool parameter is named webhookUrl, callbackUrl, webhook, or callback, MCP Explorer can auto-populate it from an active tunnel’s webhook URL directly in the Tools view — saving a round-trip to copy-and-paste. Only tunnels that are Running or Starting (and already have a webhook URL assigned) appear in the picker.
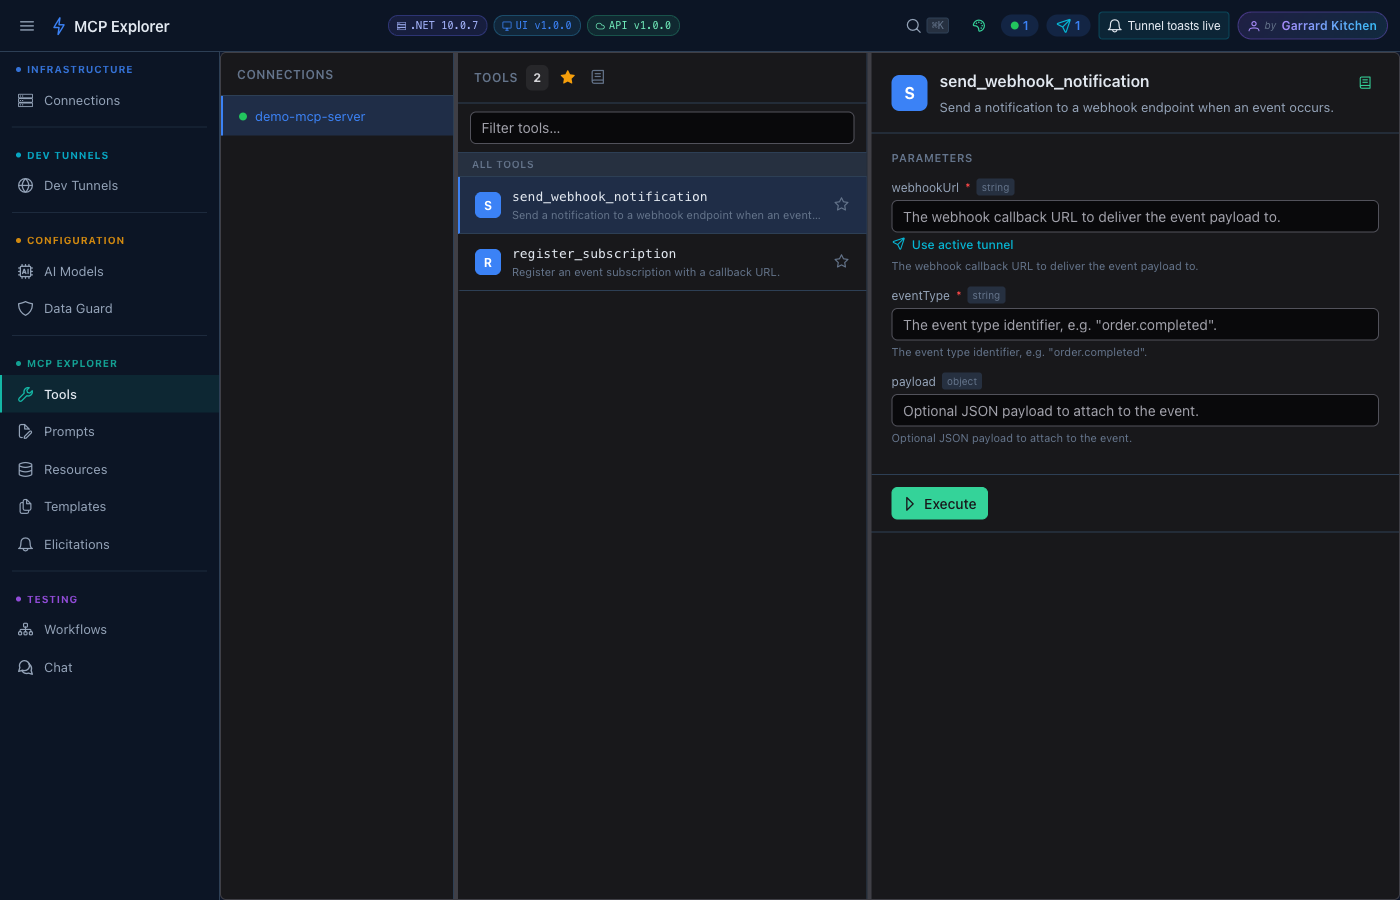
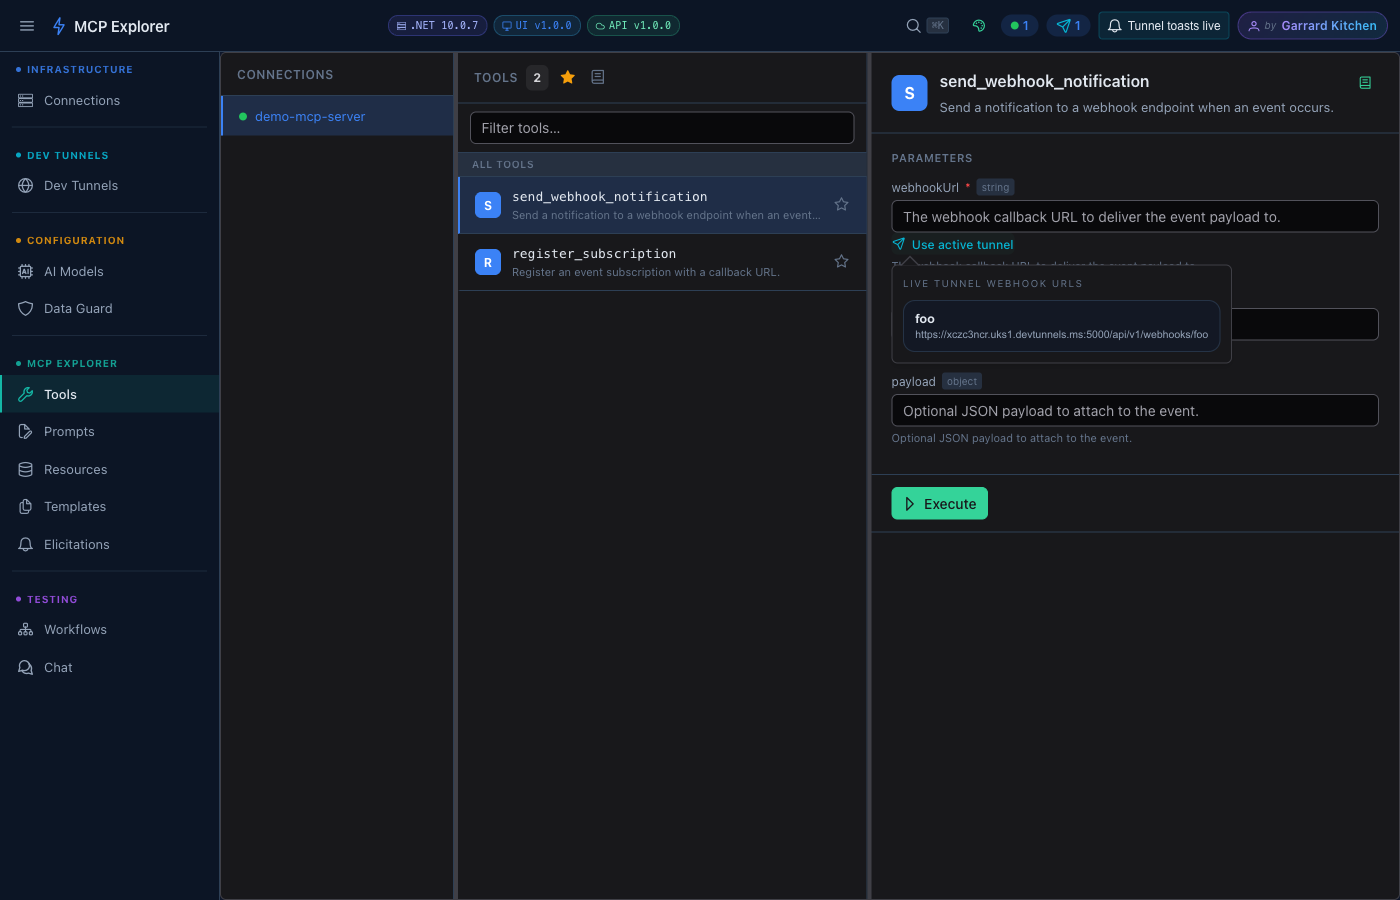
The chip next to a webhookUrl parameter lets you pick from any running tunnel. Selecting one fills the field instantly.
Clicking the chip opens a compact popover listing every eligible tunnel and its webhook URL:
Stopping and Deleting Tunnels
- Stop — halts the
devtunnel hostprocess. The tunnel definition and all captured events are preserved. You can restart it later. - Delete — removes the tunnel definition from MCP Explorer (with a confirmation dialog). If Delete on exit was checked at creation time, the tunnel is also removed from the
devtunnelservice.
Note: Stopping a tunnel does not delete captured events. All history is retained until you delete the tunnel.
Next Steps
- Browsing & Invoking Tools — use the Webhook URL smart-fill in the Tools view
- Managing Connections — connect to an MCP server to use with tunnel-triggered workflows
- Building Workflows — chain tool calls triggered by incoming webhook events